Psychology Studies Managers Quote: Only 36% Replicated
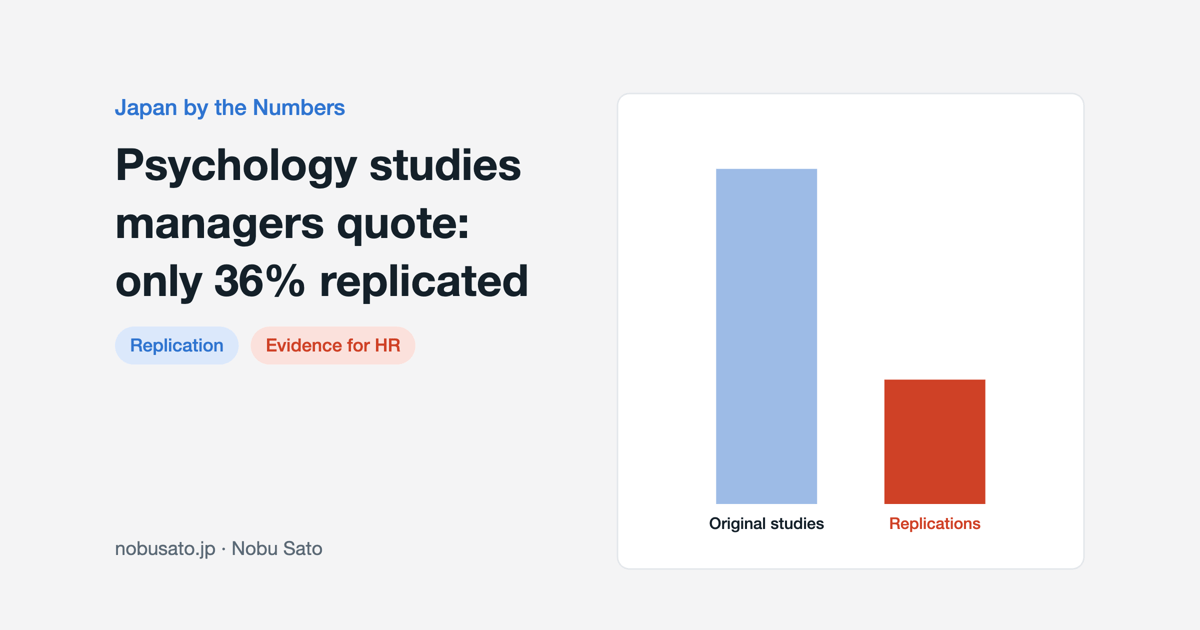
Many of the psychology studies managers quote don't hold up. When 100 published psychology studies were run again by independent teams, only 36% produced a significant result. The originals had claimed 97%. If a study is about to end up in your hiring rubric or your performance review form, you should know about that gap.
I bring this up because the studies managers love most are often the shakiest. Global training decks still open with the Stanford Prison Experiment. Assessment vendors in Tokyo and elsewhere still say "research shows." I lean on classic theories on this blog too, so at the end I put my own posts under the same light.
What did the big replication project find?
The reference point is the Open Science Collaboration's "Estimating the reproducibility of psychological science," published in Science in 2015. It was a large, coordinated replication. Teams picked 100 experimental and correlational studies from the 2008 issues of three leading psychology journals, used the original materials where they could, and reran them with more statistical power. The project ran from November 2011 to December 2014.
97% of the original studies reported significant results (p < .05). 36% of the replications did. Only 47% of original effect sizes fell inside the replication's 95% confidence interval, and the teams judged 39% of effects to have replicated. The average effect size, converted to a correlation r, fell from 0.403 to 0.197. Roughly half.
Fig.1In the Open Science Collaboration's 2015 replication of 100 psychology studies, the share of significant results fell from 97% to 36%, and the mean effect size fell from r = 0.403 to r = 0.197.
Two cautions before you read too much into this. The 100 studies weren't a random sample of psychology. They came from three journals in one year, picked partly because they were feasible to rerun. The field mattered too. In the paper's own breakdown, 50% of cognitive psychology studies (21 of 42) replicated with a significant result, against 25% of social psychology studies (14 of 55). So "64% of psychology is false" is the wrong takeaway. The authors found that the strength of the original evidence predicted replication success better than who ran either study. People had simply trusted a single significant result too much.
Why do effects shrink on the second try?
The main culprit is that journals favor significant results. A small study that gets a big effect by luck gets published. The ones that found nothing stay in the drawer. Run the study again and the luck washes out, so the effect looks smaller.
If you hire, you've seen this in people. The candidate who shone in one interview often doesn't shine the same way in the second. One strong signal usually comes back weaker.
Where do the famous management stories stand now?
The Stanford Prison Experiment
In 1971, 24 male students were split into guards and prisoners in a mock prison in a Stanford basement. The study was planned for two weeks and stopped after six days. It became the go-to story for "give ordinary people power and they turn cruel."
Thibault Le Texier, a French researcher, went through the archives and interviewed 15 participants. His 2018 book, Histoire d'un mensonge, and his 2019 paper "Debunking the Stanford Prison Experiment" in American Psychologist report that the guards were given precise instructions on how to treat the prisoners. That looks a lot more like people doing what the researchers wanted than like cruelty emerging on its own. Zimbardo and colleagues have disputed the critique. Still, as evidence of what people do when left alone with power, the study is badly weakened. The broader idea that situations shape behavior is a separate claim, and it survives.
The marshmallow test
The popular version: four-year-olds who wait for the second treat do better in school years later. The follow-up behind it, Shoda, Mischel and Peake (1990, Developmental Psychology), tracked children from a preschool on the Stanford campus. Of 653 children, 185 could be followed up, and the SAT correlations in the key condition rested on about 35 kids.
Watts, Duncan and Quan (2018, Psychological Science) ran a conceptual replication. Same question, different and much larger data: 918 children from the US NICHD Study of Early Child Care and Youth Development. The link between waiting time and achievement at 15 was about half the size of the original. Controlling for family background, early cognitive ability and the home environment cut it by another two thirds. A lot of what looked like willpower was the household showing through.
Ego depletion
"Willpower is a battery, so make big decisions in the morning" goes back to experiments by Baumeister and colleagues in 1998. Hagger and colleagues ran a preregistered multi-lab replication (2016, Perspectives on Psychological Science) across 23 labs and 2,141 participants. The effect was d = 0.04, with a 95% confidence interval from −0.07 to 0.15. Essentially zero. Some researchers argue the task they used was too weak, and the debate isn't settled. Either way, I wouldn't build a policy on it.
A filter before "a study says" becomes policy
Before any claim gets near a selection process or a review form, I ask four questions.
Who was studied, and how many? Students, children and working adults are different populations, and 35 people is different from 3,000.
Has an independent team replicated it, ideally with a preregistered design?
How big is the effect once other factors are controlled? Significance alone tells you little.
Was it tested on people at work? None of the three studies above were.
If all four come back well, it can inform a system. Two or three, and it's a hypothesis: try it small and check it against your own data. None, and it's a story for a workshop opener. When a vendor tells your Japan team a tool is "scientifically proven," ask for the name of the paper first. The same habit applies to statistics that look official. Japan's two overtime numbers differ by eight hours depending on who reports and who gets counted.
Now apply it to my posts
This blog leans on classic theories, and some of them are contested. Herzberg's two-factor theory comes from 1959 interviews with 203 engineers and accountants around Pittsburgh, who recalled times they felt especially good or bad about work. Critics since King in Psychological Bulletin (1970) have argued that the split between the two factors may come from that interview method itself, a point that post also raises.
Dunbar's number is estimated from primate brain size, and my Dunbar post notes the academic dispute. The Allen curve comes from observing R&D engineers in the 1970s, long before Slack. Ringelmann's rope-pulling data were published in 1913, and a later experiment by Ingham and colleagues (1974) suggested most of the lost effort was motivation rather than coordination.
I keep using them as drawing aids for org design. I don't treat them as laws, and I wouldn't feed any of their numbers straight into how someone is paid or rated. Read my posts with the same four questions. If one of them fails, I'd like to hear about it.
Sources
- Open Science Collaboration (2015), Estimating the reproducibility of psychological science, Science 349, aac4716: significant results 97% to 36%, mean r 0.403 to 0.197
- University of Edinburgh repository: full text of the same paper (47%, 39%, cognitive 50% vs social 25%)
- Le Texier, T. (2019), Debunking the Stanford Prison Experiment, American Psychologist 74(7), 823–839: archives and interviews with 15 participants
- Haney, Banks & Zimbardo (1972), Interpersonal Dynamics in a Simulated Prison, technical report for the Office of Naval Research: 24 selected from 75 volunteers, ended after six days
- Watts, Duncan & Quan (2018), Revisiting the Marshmallow Test, Psychological Science: 918 children, about half the original correlation, two thirds smaller with controls
- Hagger et al. (2016), A multilab preregistered replication of the ego-depletion effect, Perspectives on Psychological Science 11(4): 23 labs, 2,141 participants, d = 0.04
- King, N. (1970), Clarification and evaluation of the two-factor theory of job satisfaction, Psychological Bulletin 74(1), 18–31
- Britannica, Two-factor theory (secondary): Herzberg 1959 sample of 203 engineers and accountants
- Ingham, Levinger, Graves & Peckham (1974), The Ringelmann effect: Studies of group size and group performance, Journal of Experimental Social Psychology 10(4), 371–384
- Kravitz & Martin (1986), Ringelmann rediscovered: The original article, Journal of Personality and Social Psychology 50(5): on Ringelmann's 1913 paper
Shorter notes that don't make it into a full article go on LinkedIn. Follow me there.