In Japan, "neither agree nor disagree" is an answer
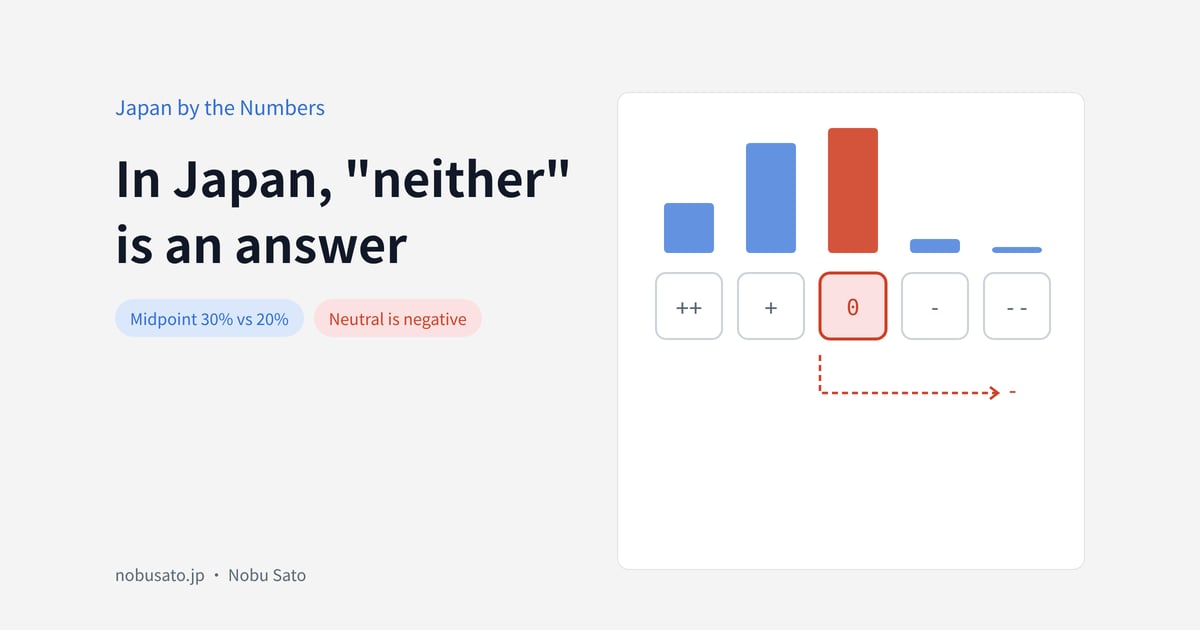
Run an employee survey with a Japanese team and the results come back with "neither agree nor disagree" as the top answer on half the items. HQ asks: is that satisfied or dissatisfied?
My answer: in Japan, that's already dissatisfied. But it helps to see why first.
Is the midpoint habit real?
The idea that Japanese respondents pick the middle is an old one, so I went through the data I could find.
The older study is from 1995: over five thousand high school students in Japan, Taiwan, the US and Canada answered the same 57 items on seven-point scales. Japanese students chose the exact midpoint on 17 items on average; American students on 11.7. Roughly 30% of items versus 20%. Real, but smaller than the legend.
The newer one is a 2020 survey by Japan's transport ministry, same questions in Japan, the UK, France and Germany. "Would you want to work at a small or mid-sized company?" Neutral: Japan 52%, UK 38%, France 41%, Germany 33%. "Is a famous university and company a sign of success?" Japan 34%, UK 19%. But "would you relocate for work?" came out Japan 25%, UK 27%, France 21%. Almost identical.
Fig.1Share choosing neutral in the transport ministry's 2020 four-country survey. Japan is clearly higher on the first two; the third is the same everywhere.
So: Japanese respondents do pick the middle more than Europeans and Americans, but not on everything. The gap opens on questions that demand a stance, where the stance might offend someone or reveal something.
Four kinds of people in the middle box
A review by Masuda and Sakagami at Keio breaks down why people choose the midpoint. From my own survey work, I sort them into four.
One: truly mixed. Satisfied with the boss on some things, not on others, depending on what you ask. Two: never thought about it. The question doesn't touch them. Three: don't want to say. They have a view, but see no upside in writing it down, even anonymously. Four: didn't understand. The item was translated from English and the Japanese is awkward.
All four look identical in the data: a 3. Management needs to find the first and third. The second can be left alone. The fourth is the questionnaire's fault.
In Japan, neutral is negative
I've run five-point scales from positive to negative many times. Japanese teams answer almost entirely between positive and neutral; the two negative boxes sit nearly empty. The first time you see that distribution, the team looks fine. After a few rounds I understood: in Japan, neutral is negative. People who are actually satisfied pick positive. Everyone else files their dissatisfaction under "can't say."
Japanese workplaces run on a default: taking a stance has a cost. Say satisfied and you look like you're currying favor. Say dissatisfied and you look like you're accusing someone. Either might be remembered. "Neither" is the only free box. That's environment, not personality. As I wrote in the exit-survey post, a questionnaire reaches the outer two layers; what people actually think sits in the inner two. "Neither" is the door between them.
The door opens. My method is to keep asking for detail, using only questions that can be answered yes or no. "Are you satisfied with how your manager communicates?" gets a 3. "In the past month, did your manager have a one-on-one with you about your work?" can only be yes or no. "Did he reply to the suggestion you made last time?" Yes or no. By the fourth or fifth detail, the neutral answer has turned negative almost every time.
Where Gallup's single digit comes from
Gallup's annual employee engagement figure has had Japan between 5% and 8% for over a decade. 2025: 8%, against a global average of 20% and around 30% for the US and Canada. HQ sees that and gets nervous.
Fig.2Gallup employee engagement, Japan, 2012 to 2025 (three-year rolling average). Dashed line: 2025 global average, 20%.
The metric counts someone as engaged only if they give top-box answers across a set of items. Japanese respondents, even the highly motivated ones, rarely give themselves full marks. A perfect score reads as bragging. So a good part of that single digit is answering style, not working state.
That doesn't mean Japanese workplaces are fine. It means comparing that number directly with the US compares two answering habits.
What I do
Three things.
First, remove the midpoint. Four or six points, no "neither." Some argue this forces the truly mixed to pick a side and distorts the data. I think the opposite: in Japan, keeping the midpoint distorts more, because every dissatisfied person hides in it. The handful of genuinely mixed people who get pushed are a price I'm willing to pay.
Second, ask about events, not attitudes. An attitude question always has an exit. An event question doesn't.
Third, treat the midpoint itself as data. Which department, which item, has the most "neither"? That's where nobody dares to speak. Far more useful than the average score. In an organizational diagnosis I pull that table out separately.
Where I'm not sure
Whether younger Japanese are moving away from the midpoint, I haven't found reliable data across years. And the cross-national studies show Chinese and Taiwanese respondents leaning to the middle too, but my sample of surveys with Chinese teams is too small to say whether they behave like Japanese ones.
In your last employee survey, which item had the most "neither"?
Sources
- Chen, Lee & Stevenson (1995) Response Style and Cross-Cultural Comparisons of Rating Scales Among East Asian and North American Students, Psychological Science 6(3)
- 国土交通省「市民向け国際アンケート調査」(2020年、日英仏独)
- 増田真也・坂上貴之「調査の回答における中間選択:原因、影響とその対策」心理学評論 57(4), 2014
- Gallup, State of the Global Workplace: Japan country-level data
Shorter notes that don't make it into a full article go on LinkedIn. Follow me there.