Muir's Super-Chicken Study: What the Papers Actually Say
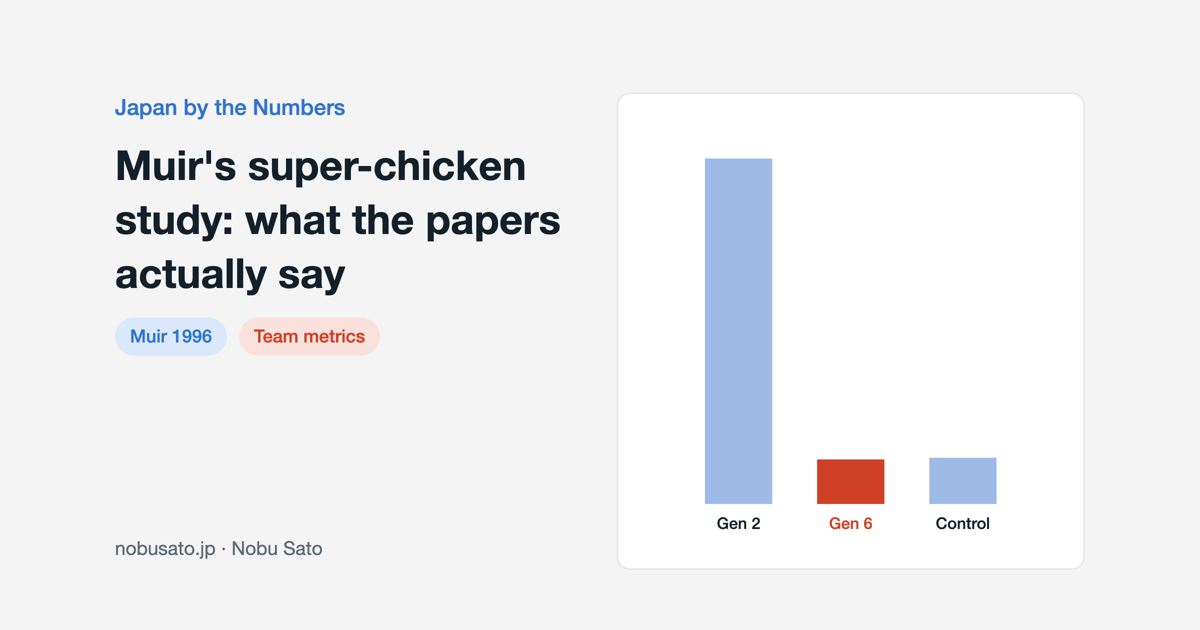
You have probably heard the super-chicken story: breed only the most productive hens, and after six generations they peck each other to death until three are left. The paper behind it reports something narrower. Selecting hens by how their whole cage did cut annual mortality from 68% to 8.8%.
That narrower result is the one worth carrying into a Japan entity that is busy hiring stars.
Where the popular version comes from
The version most people know comes from Margaret Heffernan's TED talk at TEDWomen 2015, which turned it into a story about star employees. It is a good story, and it gets quoted often in hiring and leadership workshops.
The research is by William M. Muir, an animal geneticist at Purdue University, and the main paper appeared in Poultry Science in 1996. When I read it, the super-flock of top individual layers was missing. The paper has no line selected on individual performance at all. Muir writes that he would have liked one, but the facilities did not allow it. So the claim that a cage of top layers ends in three survivors is not something this paper tested.
What Muir actually did
He ran a breeding experiment with one line of White Leghorn hens, started in 1982. Sisters from the same sire were housed together, nine to a cage in the first two generations and twelve after that. Each family was kept or culled as a group, based on the cage's record. Geneticists call this group selection.
Two details matter. From generation 2 onward, the hens kept their full beaks, so pecking injuries showed up directly in the death count. And the selection criterion changed across generations: survival alone in generation 2, an equal mix of survival and laying rate in generations 3 and 4, eggs per hen housed in generation 5. The comparison group was an unselected control line, housed one hen per cage.
Reading the 68% and the egg count
Annual mortality in the group cages fell from 68% in generation 2 to 8.8% in generation 6. The control's figure in generation 6 was 9.1%. Note the denominator: that 9.1% comes from hens living alone. The selected hens, living twelve to a cage, came to survive about as well as hens with no cage mates at all.
Egg numbers need the same care. Eggs per hen housed rose from 91 to 237. That figure divides by the hens put in the cage at the start, dead ones included, so better survival alone pushes it up. The cleaner measure of each hen's work is the hen-day laying rate, which went from 52% to 68%. Egg weight did not change. Muir reports that most of the survival gain came by generation 3, and laying kept improving by about 4% per generation after that.
Fig.1Hens bred on whole-cage performance saw annual mortality in group cages fall from 68% in generation 2 to 8.8% in generation 6, close to the 9.1% of an unselected control housed one per cage (Muir 1996). In a generation-7 test with 576 hens per line in 12-hen cages, replacements needed between weeks 17 and 44 were 287 for a commercial line, 128 for the control and 46 for the selected line (Craig & Muir 1996). Both in Poultry Science.
Why did fewer hens die?
Fewer of them were injuring each other. A companion paper by J. V. Craig and Muir, also in Poultry Science in 1996, put 576 hens each from the generation-7 selected line, the unselected control and a high-producing commercial line into 12-hen cages. According to the abstract, to keep groups at full size between weeks 17 and 44, the commercial line needed 287 replacement birds, the control 128 and the selected line 46. That is roughly one sixth of the commercial figure. Among cages with a cannibalism death, the commercial line had twice as many cages with repeated losses.
The commercial line comes from a different genetic background, so the one-sixth gap is not purely an effect of the selection method. The fairer comparison is 128 against 46, control against selected, same origin.
A third paper on behavior adds a twist. Selected hens made fewer aggressive acts in their home cages than control hens. But in one-on-one contests, selected roosters were more aggressive than control roosters and more dominant against them. Group selection did not breed a placid bird.
The leap from hens to teams is mine
From here on this is my reading, not the paper's. People are not bred, and offices are not cages. A poultry experiment says little about organizations directly.
One structure does carry over, I think. If you only measure individuals, you cannot see the individual who lowers everyone else's output. Muir later formalized these effects on cage mates in breeding value models (Muir 2005, Genetics). In a quail experiment he reported there, the line selected only on each bird's direct genetic effect on its own weight had rising mortality per hatch, while the line that accounted for effects on others did not. Still birds, still a single experiment.
The pattern I often see in Japan entities of foreign companies: the founding team hires one star after another from big-name employers. Each CV has strong numbers. After joining, two of them chase the same accounts, information stays in people's inboxes, and the team total is smaller than the sum of the CVs. Each star's own number still looks fine, so the review process never flags it.
A big brand also makes it harder to separate a person's contribution from the team's and the company's. I once interviewed a candidate for head of sales strategy who listed initiative after initiative and stalled each time I asked for one specific case. That is why I argue for scoring the role before the person: you need to know what the job requires before the brand on the CV can do your thinking for you.
Put one team number into every review
In evaluation design, I would put at least one team-level number next to the individual ones. Tie part of the bonus to team revenue or retention. Record, even informally, who helped a new colleague get productive. Without something like this, effects on others never reach the review form.
Making everything a team number fails the other way. As I wrote in the post on the Ringelmann rope-pulling effect, shared targets let individual effort slide, so each module still needs one named owner. Both kinds of number, side by side.
In hiring, I ask referees whether they would work with the candidate again. In Japan the answer tends to be polite. I have seen a candidate with uniformly warm references turn out to be well short on execution, so I listen for hesitation and for whether the referee can give a concrete example.
Muir's result took six generations of selection. A Japan team turns over far faster, and I do not know whether a team metric changes behavior within a couple of review cycles. Putting the star's number and the team's number on the same page at the next review costs almost nothing, though, and that is where I would start.
Sources
- Muir, W. M. (1996) Group selection for adaptation to multiple-hen cages: selection program and direct responses. Poultry Science 75(4):447-458 (annual mortality 68% to 8.8%, control 9.1%; eggs per hen housed 91 to 237; hen-day rate 52% to 68%)
- Craig, J. V. & Muir, W. M. (1996) Group selection for adaptation to multiple-hen cages: beak-related mortality, feathering, and body weight responses. Poultry Science 75(3):294-302 (abstract; replacements weeks 17 to 44: 287 / 128 / 46)
- Craig, J. V. & Muir, W. M. (1996) Group selection for adaptation to multiple-hen cages: behavioral responses. Poultry Science 75(10):1145-1155 (abstract)
- Muir, W. M. (2005) Incorporation of competitive effects in forest tree or animal breeding programs. Genetics 170(3):1247-1259 (quail experiment; summarized via Purdue University news release, 2005)
- TED, Margaret Heffernan, Forget the pecking order at work, TEDWomen 2015 (source of the popular version)
Shorter notes that don't make it into a full article go on LinkedIn. Follow me there.