Why do queues get long all at once?
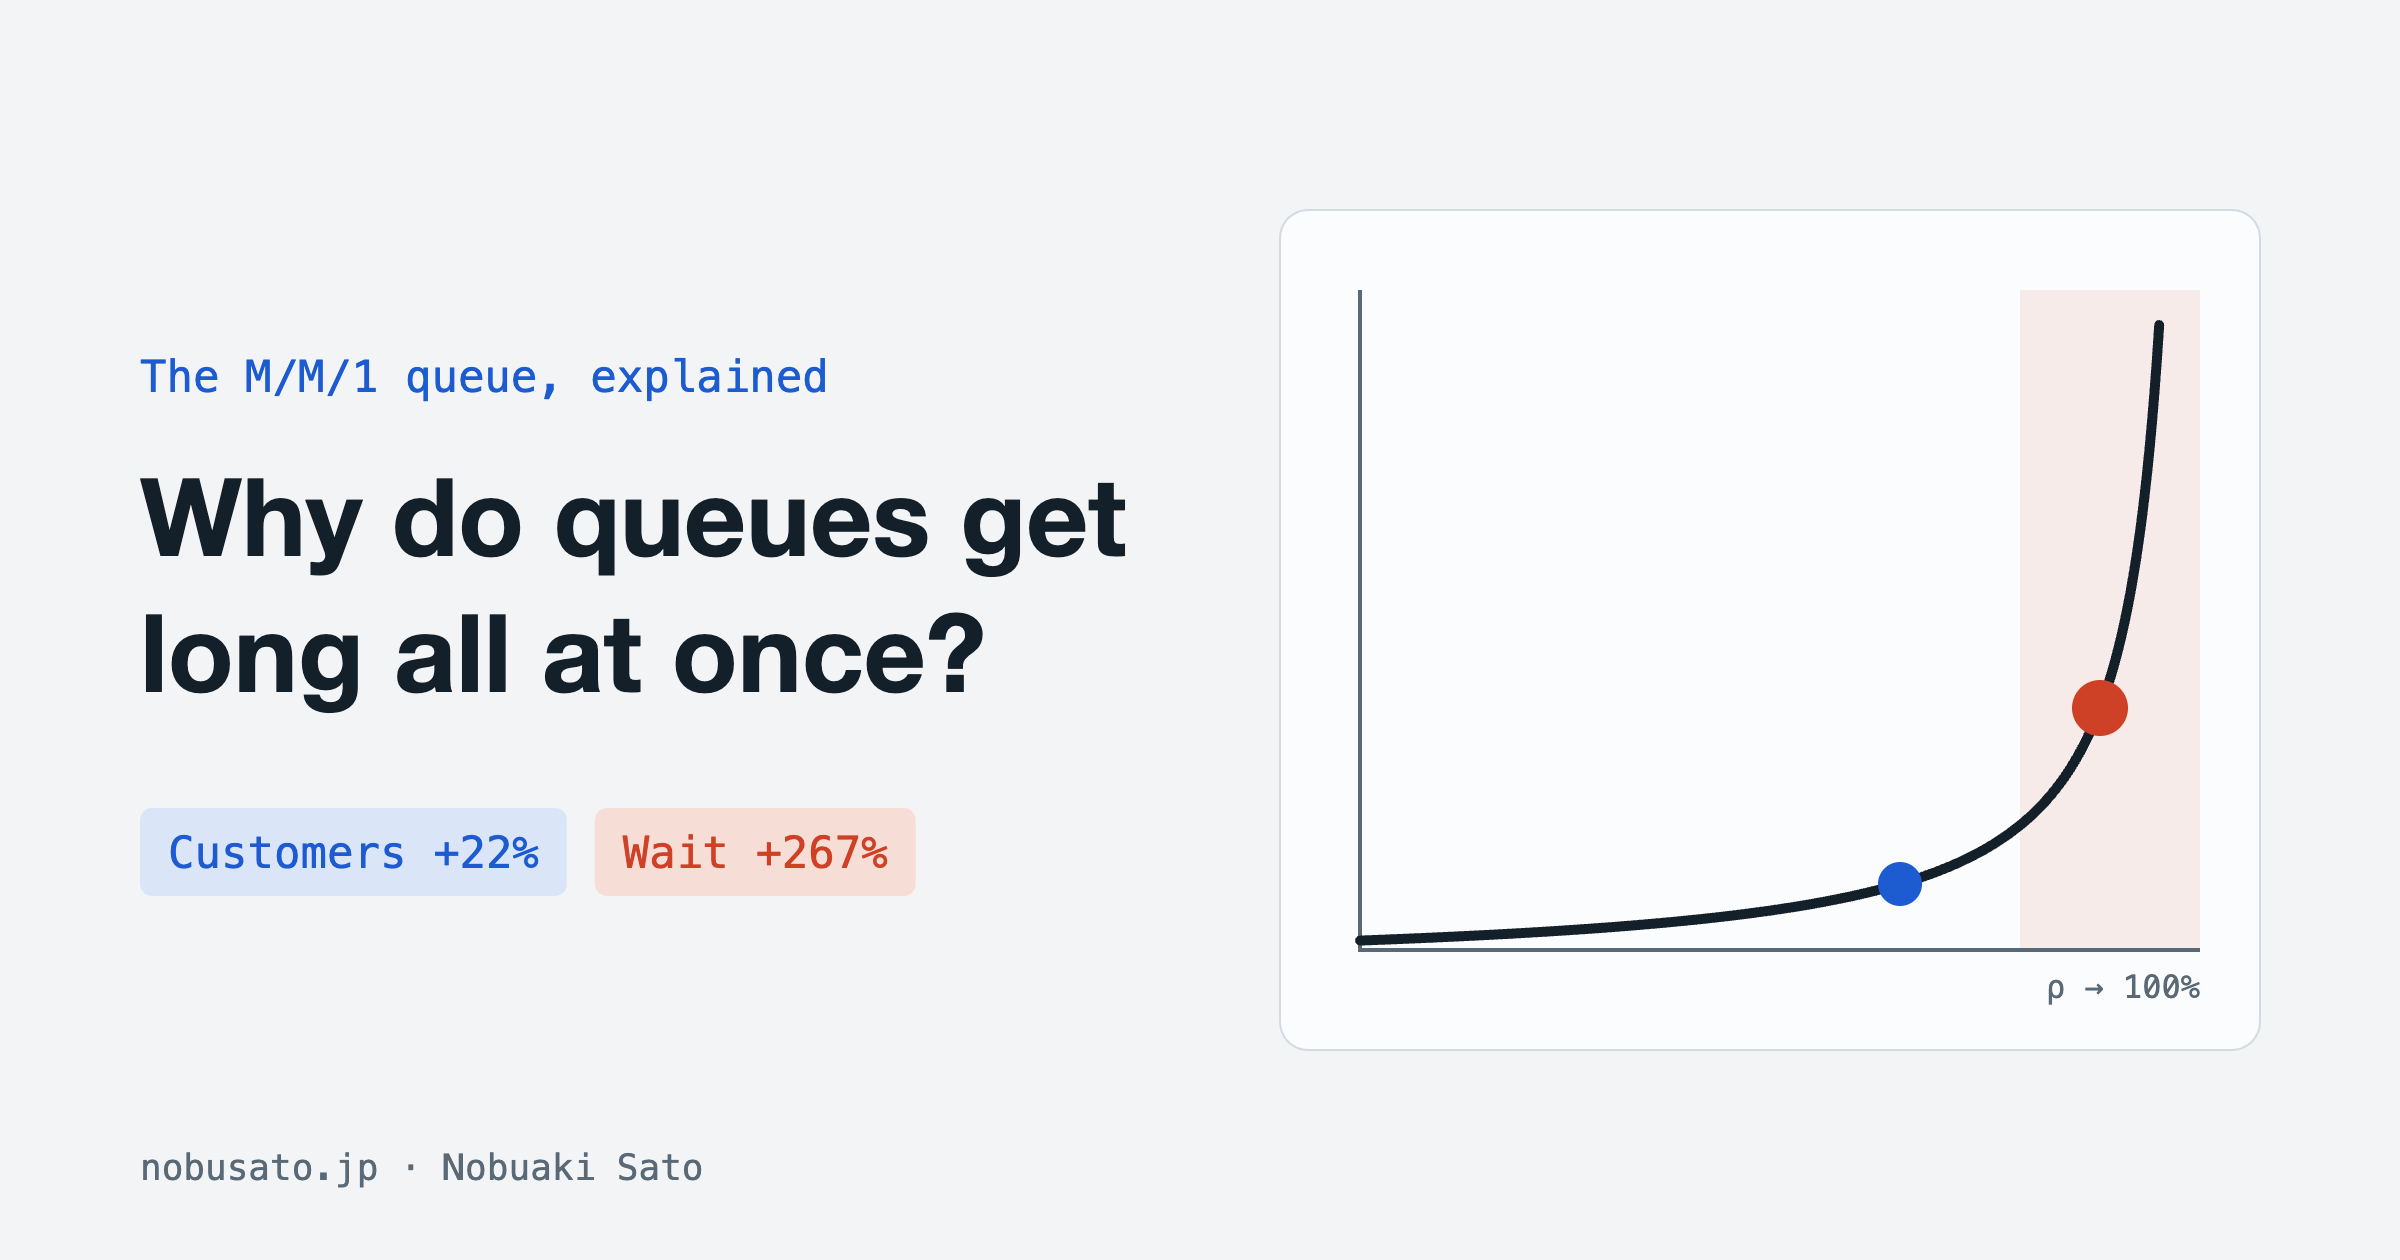
Anyone who has run recruiting knows the pattern. Candidates asking "any update?" don't come in evenly. They tend to arrive in the same week, usually a week when nothing obvious changed. Nobody slacked off and applications didn't double. The team got a little busier, and replies started slipping by days.
I once handled interview scheduling for 400 requests from 12 business units, all completed within two weeks. Counting only weekdays, that's about 40 a day. When I think about what is going on under that kind of volume, the most useful tool I know is the simplest model in queueing theory. There is one formula below; you can skip it and still follow along.
Fig.1Going from 45 to 55 customers an hour is about 20% more traffic, yet the average wait goes from 3 minutes to 11.
Start with a coffee stand
To keep things simple, picture a stand with one barista. She makes a drink a minute on average, so 60 an hour. In the morning about 45 customers come in each hour, which leaves a quarter of her capacity unused.
Then the owner runs a promotion and traffic rises to 55 an hour, 22% more. Most people would guess the wait grows by a similar share. Run the numbers and the average wait goes from 3 minutes to 11. Nearly four times as long.
Why it happens
There are two reasons. Customers don't arrive evenly, and the barista's idle time can't be saved for later.
The chart below shows 16 customers over 24 minutes. On average that's fewer than one a minute, yet a few times three people walk in almost together, and that's when the line forms. Over the same 24 minutes the counter sits empty for 8 minutes in total. That capacity can't be moved to the next rush.
Fig.2Idle time adds up to 8 minutes, yet up to 3 people wait at once and the longest wait is 2.1 minutes.
Less slack, much longer waits
The formal version is the M/M/1 model: random arrivals, random service times, one server. How busy it is comes down to utilization, ρ, the arrival rate divided by the service rate. The average wait is ρ/(μ−λ), and it climbs fast as the denominator approaches zero.
The numbers may say it more plainly. With capacity fixed at 60 an hour, the average wait is 1 minute at 50% utilization, 4 minutes at 80%, 9 at 90% and 19 at 95%. Going from 80% to 95% makes the wait almost five times longer. Drag the slider and watch where the red dot starts to shoot up.
| ρ | Avg. queue Lq | Avg. wait Wq (min) | Zone |
|---|---|---|---|
| 50% | 0.5 | 1.0 | Calm |
| 80% | 3.2 | 4.0 | The knee |
| 90% | 8.1 | 9.0 | Steep |
| 95% | 18.1 | 19.0 | Near collapse |
Fig.3Capacity is fixed at 60 an hour. Past about 80% utilization the curve turns sharply upward.
Real lines are messier than the average
The formula gives you averages. A real line stays quiet for a while, then jumps and takes a long time to drain. The simulation below sends customers in at random. Set it to about 54 an hour and watch for a minute; you'll see the kind of mess an average hides. Leave it running and the measured wait drifts toward the theoretical value.
This simulation runs in a browser with JavaScript enabled.
Fig.4A random simulation; roughly 6 simulated minutes pass each second. Changing the rate restarts the count.
What this means for recruiting
Back to recruiting. Almost everything on a recruiter's desk is a queue: scheduling interviews, replying to candidates, waiting on a hiring manager's decision, getting an offer approved. Work arrives at random, and the number of people handling it is fixed. With twelve departments sending requests, each on its own schedule, arrivals are close to random.
From what I've seen, many recruiting teams are managed by utilization. If someone has room, they get another req. This curve shows where that runs into trouble. Add one more req to a team already above 90% and replies slow down across the whole team. Candidates remember how many days they waited.
People also say a team at 90% still has 10% to spare. On average, yes. But at that point the average queue is over 8, sixteen times what it is at 50%.
When you can't add people, the lever is variability. Block interview slots at the start of each week. Standardize request forms so each task takes about the same time. Neither adds capacity, but both pull the curve down. You won't get variability to zero, though. Even with perfectly fixed service times, random arrivals only cut the average queue in half, so some slack still has to stay.
From the outside, a team with slack can look like it isn't working hard. I tend to think that slack is what protects the candidate experience. How much to keep probably depends on the kind of work, and I don't have a settled answer yet. If I had to name a reference point, it would be around 80%, where the curve starts to bend.
Model assumptions: Poisson arrivals, exponential service times, one server, first come first served. Figures use μ = 60 per hour.